


Verse
Blog
How to Clearly Explain PPA Performance Variance to Leadership


Table of contents
Managing PPA performance after a contract goes live is one of the most underrated challenges in energy procurement. You negotiated the deal … now the real work begins.
Suddenly, the questions shift.
Is the asset performing the way it should? Why is the budget off this month? Are the developer’s explanations about curtailment, basis risk, or weather actually valid? And perhaps most importantly: how do you explain all of this clearly to finance, sustainability, and executive leadership without drowning them in spreadsheets?
That is the real challenge of managing an operational PPA.
Once a contract is live, success is no longer just about deal terms. It is about understanding performance in a volatile market and turning complex outcomes into clear, defensible explanations. Leadership does not want a pile of interval data. They want to know what happened, why it happened, and whether they should be concerned.
The good news is that there is a practical way to do this.

The problem: plenty of data, not enough PPA performance clarity
Operational renewable assets generate enormous amounts of data. There is generation data, pricing data, availability information, curtailment records, weather data, settlement terms, forward curves, basis exposure, environmental attributes, and more.
The issue is rarely a lack of information. The issue is interpretation.
Most teams are not asking for more raw data. They are asking performance questions questions:
- Is this asset performing as expected?
- Why are we above or below budget?
- Was this variance caused by weather, operations, or the market?
- Is the developer’s explanation valid?
- What should I tell leadership?
This is where many teams get stuck. They have the invoice. They may even have the meter data. But they do not always have a structured way to explain performance confidently and consistently.
And that matters for PPA performance, because renewable PPAs do not behave like conventional assets.
Why renewable PPA performance is harder to explain
A conventional asset generally responds to price. If prices are high, the asset can run harder and earn more. Renewable assets do not work that way. For a wind or solar project to produce a strong financial outcome, three things have to align at the same time:
- Resource availability. Was there wind? Was there sun?
- Market price. Were prices favorable when the asset was generating?
- Timing and operations. Was the asset actually online and able to produce during those valuable intervals?
That combination is what makes renewable asset performance so challenging to interpret.
You can have strong wind and high prices, but the asset may be iced out. You can have the asset fully available, but prices may be weak. You can have high prices and the asset online, but no wind or sun. Performance depends on overlap, not averages.
That is also why forecasting and variance analysis are so difficult. Leadership often expects a clean comparison between forecast and actuals, but operational PPAs live in a world of shifting weather, market dynamics, capture rates, and contract mechanics.
The goal is not to eliminate that complexity. The goal is to explain PPA performance clearly.
A better framework for explaining PPA performance
A practical way to evaluate and communicate PPA performance is through four core pillars.
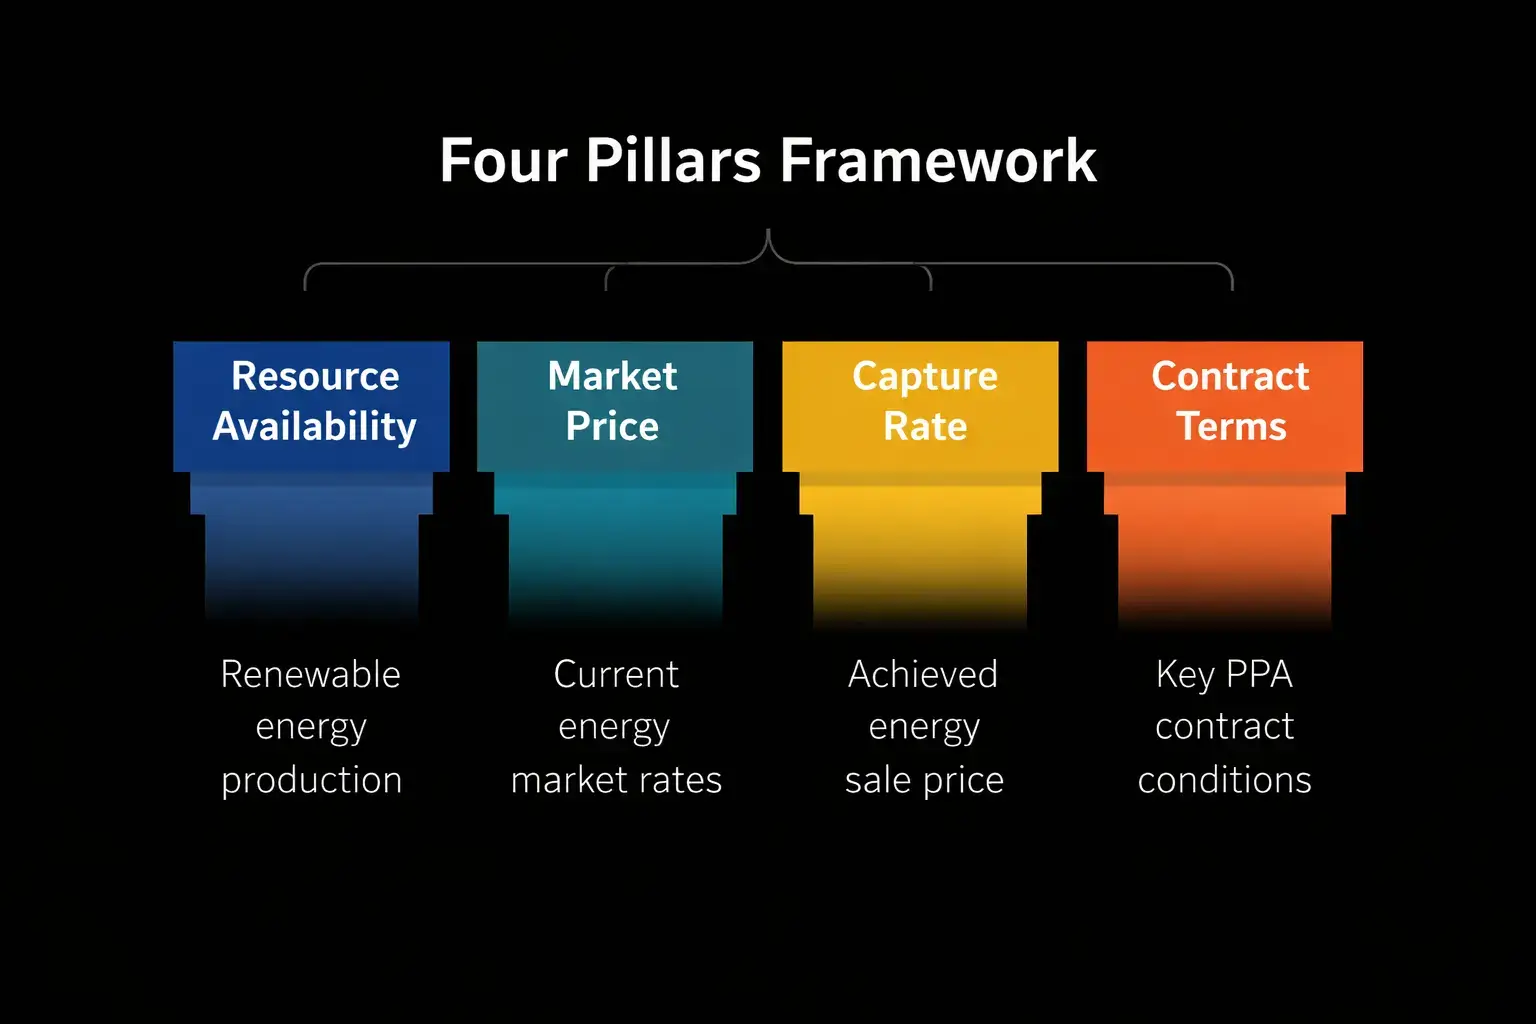
Resource availability: was the fuel there?
The first question is the most basic: did the asset have the resource it needed to generate?
For wind projects, that means wind speed. For solar assets, it means irradiance. If production was low, leadership needs to know whether that was driven by weaker-than-expected resource conditions or something else.
This is where benchmarking matters. It is not enough to say wind speeds were low or solar radiation was below average. That data only becomes useful when it is compared to something meaningful, such as:
- The same month last year
- A long-term average
- The assumptions used in the forecast
This helps answer a simple but important question: was lower generation a reflection of weaker natural resource conditions, or was something operational going on?
Market price: what was happeningon the grid?
The next layer is the market itself.
Even if resource availability is strong, price outcomes can vary significantly depending on broader grid conditions. Across many markets, a few factors tend to do the heavy lifting in determining price:
- Natural gas prices
- Temperature and demand swings
- Net load dynamics
- Regional congestion and hub-specific behavior
This is why leadership reporting should never stop at “prices were lower than expected.” The more useful explanation is what drove prices lower or higher.
Maybe mild weather reduced demand. Maybe gas prices softened. Maybe congestion at the hub changed the expected value of production. Maybe load growth from data centers is starting to reshape the market in a specific region.
When you can connect market price outcomes to recognizable drivers, variance becomes easier for non-specialists to understand.
Capture rate: when PPA performance timing matters more than volume
This is one of the most important concepts in modern PPA performance management.
Average market price does not tell the whole story. What matters is the price the asset captured when it generated.
As renewable penetration grows, capture rates are becoming more important because more wind and solar on the grid can push down prices precisely during the hours those assets are generating. In other words, the asset may produce plenty of megawatt-hours, but those megawatt-hours may be worth less than expected because of timing.
This is especially important in high-renewable markets. Wind can depress prices during windy intervals. Solar can suppress midday prices when solar output floods the grid. Over time, this “cannibalization effect” becomes a real driver of financial performance.
For leadership, the message should be simple: the asset did not just underperform or outperform because it generated more or less. It also mattered whether it generated during valuable intervals.
That nuance is critical.
Contract terms and developer claims: are the settlement mechanics being applied correctly?
Finally, there is the contract itself.
Even if generation and market behavior are well understood, settlement outcomes still depend on the specific mechanics of the agreement. That includes:
- Price floors and ceilings
- No-settlement periods
- Upside sharing
- Basis adjustment intervals
- Availability or performance guarantees
- Curtailment and force majeure provisions
These terms can materially change monthly settlement outcomes. In some cases, basis-related selections alone can shift net spend by tens of thousands of dollars. This is also where teams need to trust, but verify.
Developers generally provide detailed reports and explanations, but these are still financial settlements tied to contractual obligations. If a developer attributes underperformance to weather, teams should ask:
- Were the site conditions actually severe enough?
- Was the asset available when the resource was present?
- Does the contract allow the claimed treatment?
The same is true for curtailment and basis adjustments. The question is not whether the explanation sounds plausible. It is whether the data and contract language support it.
Why near real-time visibility changes the conversation
One of the clearest examples of this challenge comes during major market events.
Let’s skip politics and geopolitical happenings and turn our focus to something like a winter storm. Prices spike. Leadership immediately wants to know: did our asset capture the upside?
The problem is that traditional developer invoicing often lags by many weeks. By the time the monthly settlement arrives, internal questions have already been asked, budgets may already be in motion, and teams are left waiting for answers.
Near real-time telemetry changes how teams monitor PPA performance entirely.
With direct and near-real-time access to revenue meter data, weather inputs, and in parallel with contract-specific settlement logic, teams can assess performance much sooner. Instead of waiting for the developer invoice, they can understand whether the asset was online, whether it captured high-value hours, and what that likely means financially.
That does not just improve reporting. It changes internal confidence. It also allows for actions to be taken to hedge results, which we won’t get into… today.
Finance does not want to hear “we will know next month.” Leadership wants to know what happened now.
What leadership actually needs
The mistake many teams make is assuming leadership wants the full analysis.
They do not.
They want the answer first followed by sound reasoning as to how you got to the answer.
A good PPA performance update can often be summarized in one sentence:
We were above budget this month because strong price capture offset weaker-than-expected wind resource.
Or:
We were below budget because the asset was unavailable during high-value intervals, despite strong market pricing during the storm.
That is the headline. Then the supporting structure can come underneath it:
- Resource conditions
- Market price drivers
- Capture rate impact
- Relevant contract mechanics
The framework matters because it creates consistency. When leadership sees the same structure month after month, performance reporting becomes easier to absorb and easier to trust.
That is when teams stop reacting to surprises and start managing proactively.
The bottom line
Operational PPA performance management is not just about validating invoices. It is about building a clear, repeatable way to explain PPA performance in markets that are inherently volatile.
The teams that do this well are not necessarily the ones with the most data. They are the ones with the best framework.
When you break PPA performance into resource availability, market price, timing and capture, and contract mechanics, you create a narrative that finance, sustainability, and executives can actually use.
That is what turns PPA performance from a black box into a leadership conversation you can lead with confidence.
Frequently Asked Questions
What is PPA performance variance?
PPA performance variance refers to the difference between expected and actual financial or generation outcomes under a power purchase agreement, driven by factors like weather, market prices, capture rate, and contract mechanics.
Why is capture rate important in renewable PPA management?
Capture rate reflects the average price an asset receives when it generates—not the overall market average. As renewable penetration grows, assets can generate heavily during periods of suppressed prices, making capture rate a critical metric.
How often should I report PPA performance to leadership?
Monthly reporting aligned to settlement cycles is standard, but near real-time telemetry allows teams to flag significant variance events—like weather-driven price spikes—much sooner.
What causes budget variance in a renewable PPA?
Budget variance typically stems from one or more of four factors: resource availability (wind/solar conditions), market price movements, timing and capture rate, and contract-specific mechanics like curtailment or basis adjustments.
PPA Performance and Risk Assessment
Pressure-test performance visibility, variance explainability, and cross-functional alignment across finance, sustainability, and energy with this 5-minute assessment.