


Exactly one year ago, I made a professional pivot that surprised a few people. For the four years prior, I worked as a consultant/manager...
Verse

Verse

In Verse’s recent webinar, Director of Client Enablement Sam Cotterall and Operations Business Manager Amber Lin broke down a challenge most teams run into once a deal goes live: how to clearly and confidently explain PPA performance to leadership. You negotiate a strong contract, and then the real questions start. Is the asset performing the way it should? Why is the budget drifting this month? And when developers point to curtailment, basis risk, or “market conditions,” how do you know what’s real?
The throughline was simple: most teams don’t need more data. They need a practical framework for translating asset behavior into executive-ready answers, especially in volatile markets.

Renewables create a specific kind of confusion: performance is rarely about one thing.
A single month’s outcome can be driven by a mix of:
That’s why two assets in the same region can “feel” like they experienced the same month and still land in very different places financially.
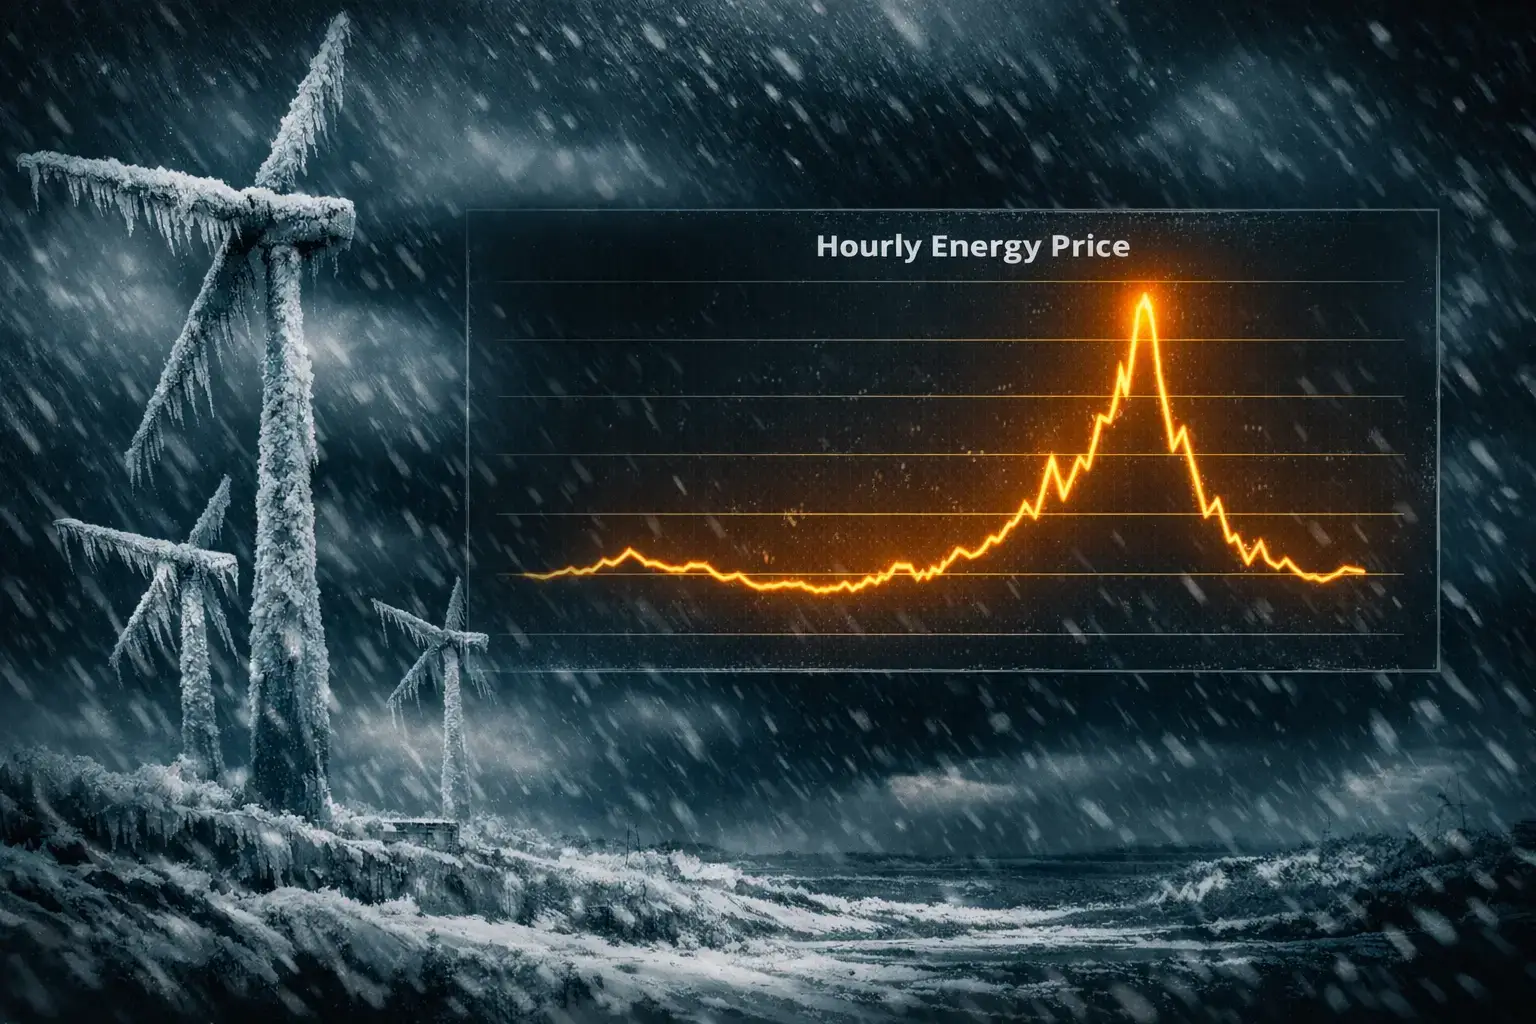
Extreme events make this painfully obvious. During winter storms, heat waves, or grid stress events, leadership questions get more urgent. Everyone wants to know, quickly, whether you captured value or missed it. The catch is that many teams don’t have a confident answer until invoices arrive weeks later. That’s what makes PPA performance so difficult to summarize in a single number.
When you’re explaining a result, the fastest way to build confidence is to use a repeatable structure. What we usually see work is breaking PPA performance into four pillars. Each one answers a distinct leadership question, and together they explain most monthly variance without getting lost in edge cases.

Verse Business Operations Manager, Amber Lin, explains how to breakdown PPA performance into four pillars. Watch the full webinar replay here.
Was the “fuel” there, and did we perform relative to expectation?
Start by separating resource-driven variance from performance issues. If wind speeds were down or irradiance was weak, that’s not a surprise in renewables. It still impacts budget, but it’s a different story than “the asset didn’t show up.”
What tends to help is comparing the month to:
This establishes the baseline before you talk about dollars.
What did prices do, and why did they do it?
Leadership doesn’t need a market lecture. They need the short causal chain.
Prices typically move because of a small number of drivers:
Your job is to translate “prices were up/down” into “here’s what changed and whether it’s transient or structural.”
Did we generate during the hours that mattered?
This is the most common disconnect: people assume more generation equals better performance. In practice, value depends on when you generated.
Capture is the bridge between asset behavior and financial outcome. It helps answer:
If you need one “executive-friendly” concept that still has analytical rigor, capture rate is usually it.
How did the PPA translate reality into settlement, and are the explanations valid?
Even strong internal teams get tripped up here, mostly because the contract logic lives in the background until something breaks.
This is where developers often point to:
The goal isn’t to assume bad intent. It’s to be able to say, confidently, “yes, that claim matches the data and the contract,” or “no, there’s a gap we need to resolve.”
Once you have the four pillars, the output should be simple.
What tends to land best with leadership is a one-page (or one-slide) summary that follows this order:
This structure does two things. It reduces the urge to overshare analysis, and it makes your explanation defensible without making it complicated.

Watch the webinar replay here and see the practical framework Sam and Amber use to translate PPA performance into executive-ready answers.
Pressure-test performance visibility, variance explainability, and cross-functional alignment across finance, sustainability, and energy with this 5-minute assessment.