


Struggling to explain PPA performance to leadership? Learn a four-part framework covering resource, market, capture rate, and contract...
Sam Cotterall
Director of Client Enablement

Sam Cotterall
Director of Client Enablement
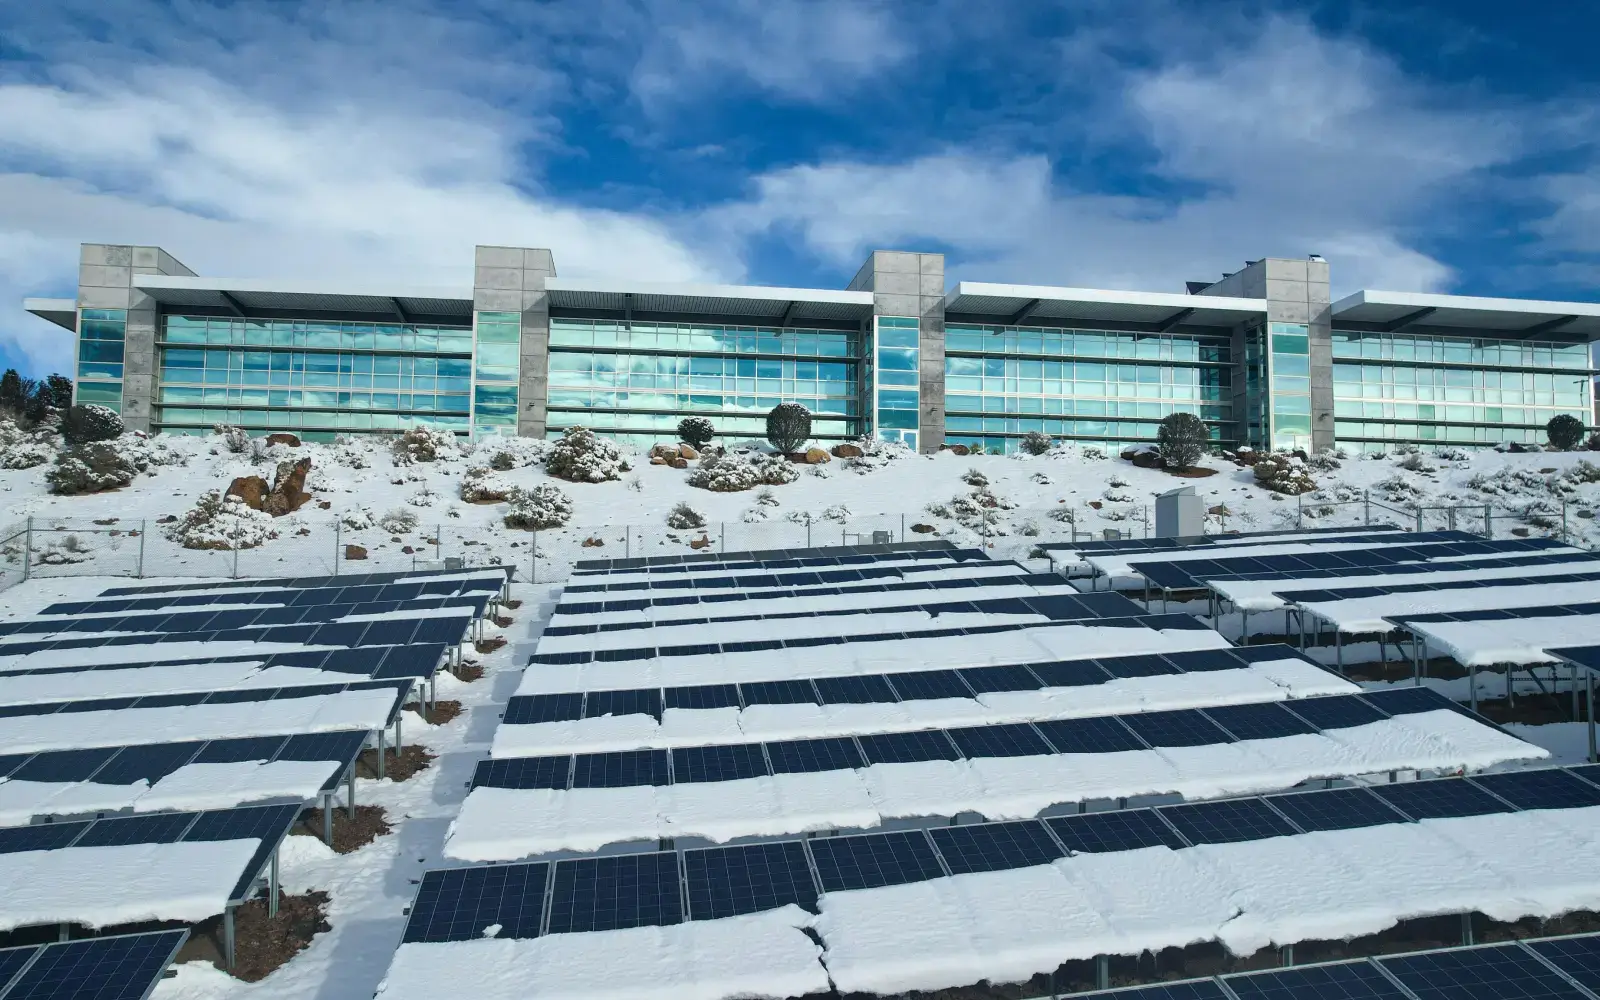
When forecasts began showing an arctic blast aiming for Texas last week, an all-too-familiar anxiety rippled through the energy market. The ghosts of 2021’s Winter Storm Uri were present in every boardroom and operations center.
Winter Storm Fern arrived this past weekend with biting cold, significant icing winter peak load records.
But this time, the lights stayed on. The grid held.
As a Verse customer, you aren’t just reacting to headlines; you have the granular data to understand why. While others are asking if the grid is fixed, you are already equipped to answer your management team’s most pressing questions about risk, exposure, and market performance.
Here is the data-driven narrative of how ERCOT managed Winter Storm Fern, and why having visibility into these nuances matters.
The first question from leadership is inevitably: “Was Fern another Uri?”
Based on the data from this weekend, the answer is a cautious yes. That said, the structural integrity of the ERCOT grid has fundamentally changed in five years.
Winter Storm Fern brought conditions and demand eerily similar to the 2021 disaster, yet the outcome was vastly different.
| Winter Storm Uri (2021) | Winter Storm Fern (Jan 2026) | |
| The Stress Test | Estimated Peak Load: ~77 GW | Actual Peak Load: ~78 GW |
| The Outcome | Blackouts | Stable Grid (Weather Watch only) |
| Reserve Margin | Collapsed to negative | Maintained ~11,000 MW Buffer |
| Key Failure | 52 GW of generation froze and was offline | Minimal thermal outages; supply chain held, batteries kicked in, and solar shined |
The difference wasn’t luck. It was ~40 GW of new capacity added since 2021, aggressive winterization mandates for gas plants, and proactive measures like the DOE’s emergency order allowing industrial demand response.
The real MVPs of the weekend? The 7 GW “Battery Buffer” and new-build solar. During critical morning ramps, utility-scale storage discharged at full capacity, smoothing out volatility that previously would have destabilized the grid. The other hero emerged on Monday, January 26, when newly added solar capacity played an outsized role, providing a significant portion of the generation mix during the day as skies cleared.
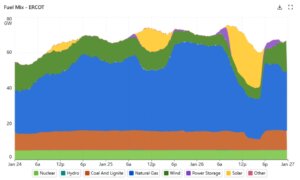
Source: Gridstatus.io
While the system held together, “Texas” is not a monolith. Answering management’s questions requires understanding regional complexities.
If your CFO asks why the Houston facility saw a price spike on Sunday night while the West Texas facility didn’t, you need hub-specific data.
When extreme weather hits, panic is a natural human reaction. But in energy management, panic is expensive.
Winter Storm Fern proved that the ERCOT grid is more resilient than it was five years ago, but it also proved that volatility hasn’t gone away, it has just shifted form. It moved from a system-wide collapse risk to localized transmission bottlenecks and fuel-basis blowouts.
The ultimate advantage for Verse customers is the ability to move at the speed of the grid rather than the speed of the billing cycle. Through our API integration directly into asset telemetry, you have access to near-real-time data for your specific portfolio. You don’t have to wait for a mid-February invoice to see how your assets performed in the January freeze. If you have wind assets, you can see immediately if your turbines were spinning or sidelined by icing. For solar, you can track exactly how much of those Monday price spikes you captured the moment the sun broke through.
As a Verse customer, you don’t have to rely on generalizations. You have the data to pinpoint exactly where your risks were this weekend, how the grid responded, and why your strategies worked. That’s the difference between hoping the lights stay on and knowing they will (or won’t).