Energy Risk Management Software for Reducing PPA Portfolio Volatility
This video illustrates the concept of clean energy portfolio risk and why companies should go beyond traditional spreadsheet analysis and use energy risk management software when selecting projects.
How to Calculate Forecasted Net Spend for a PPA
Companies frequently use virtual power purchase agreements (VPPAs) to procure clean energy, and energy risk management software plays a critical role in evaluating those decisions. Let’s say Company A is considering three PPA offers from developers for different projects. The three offers have the same delivery term but vary in location, technology, and price.
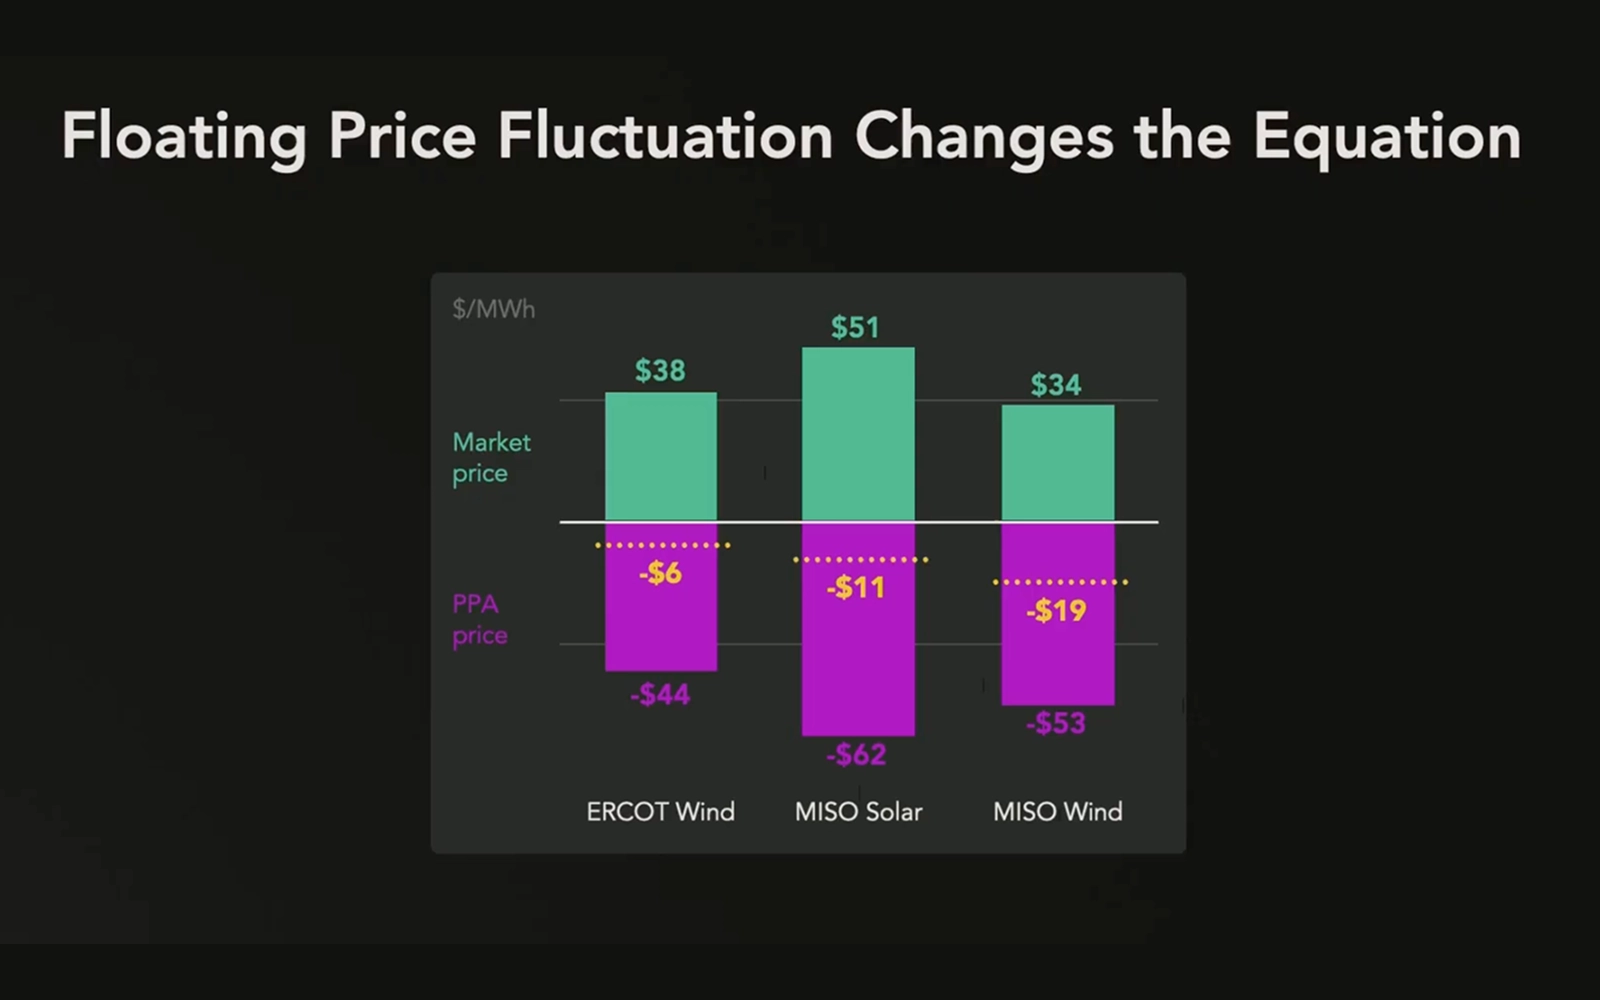
The first offer is for a wind project located in the ERCOT wholesale market with a fixed price of $44 per megawatt-hour. The second is for a solar project located in the MISO wholesale market with a fixed price of $62 per megawatt-hour. The third is for a wind project, also in MISO, with a fixed price of $53 per megawatt-hour.
Company A must now determine the fair market value of each PPA to understand its forecasted net spend. A PPA’s fair market value is calculated using two inputs: the fixed PPA price — what Company A commits to pay the developer — and the forecasted market price, which reflects what Company A would earn as revenue on a levelized hourly basis in the wholesale market. The fixed price minus the forecasted market price equals Company A’s forecasted net spend.
For the ERCOT wind PPA, with a fixed price of $44 and a forecasted market price of $38 per megawatt-hour, Company A’s forecasted net spend is $6 per megawatt-hour. For the MISO solar PPA, with a fixed price of $62 and a forecasted market price of $51, net spend is $11 per megawatt-hour. For the MISO wind PPA, with a fixed price of $53 and a forecasted market price of $34, net spend is $19 per megawatt-hour.
Based on this analysis, the ERCOT wind PPA is the most cost-effective option on a forecasted basis, while the MISO wind PPA would be the most expensive. If Company A’s primary concern is forecasted cost, this analysis would be sufficient — and it would select the ERCOT wind project.
Why Net Spend Is a Probability Distribution, Not a Fixed Number
However, there is inherent uncertainty in the net spend associated with any PPA. Although the PPA price is fixed over the life of the contract, the wholesale market price fluctuates based on supply and demand, which are influenced by wind and solar output and commodity prices for natural gas and coal. If the market price fluctuates, Company A’s net spend fluctuates too. That means the net spend for each project is not a static number — it is a probability distribution.
For the ERCOT wind PPA, Company A could end up spending significantly more or less than $6 per megawatt-hour. Comparing the net spend probability distributions for all three projects, the ERCOT wind PPA has the lowest forecasted mean cost with only a modestly wider range of outcomes — making it the most cost-effective option without a significantly riskier profile.
The Missing Variable: Factoring in Your Electric Load
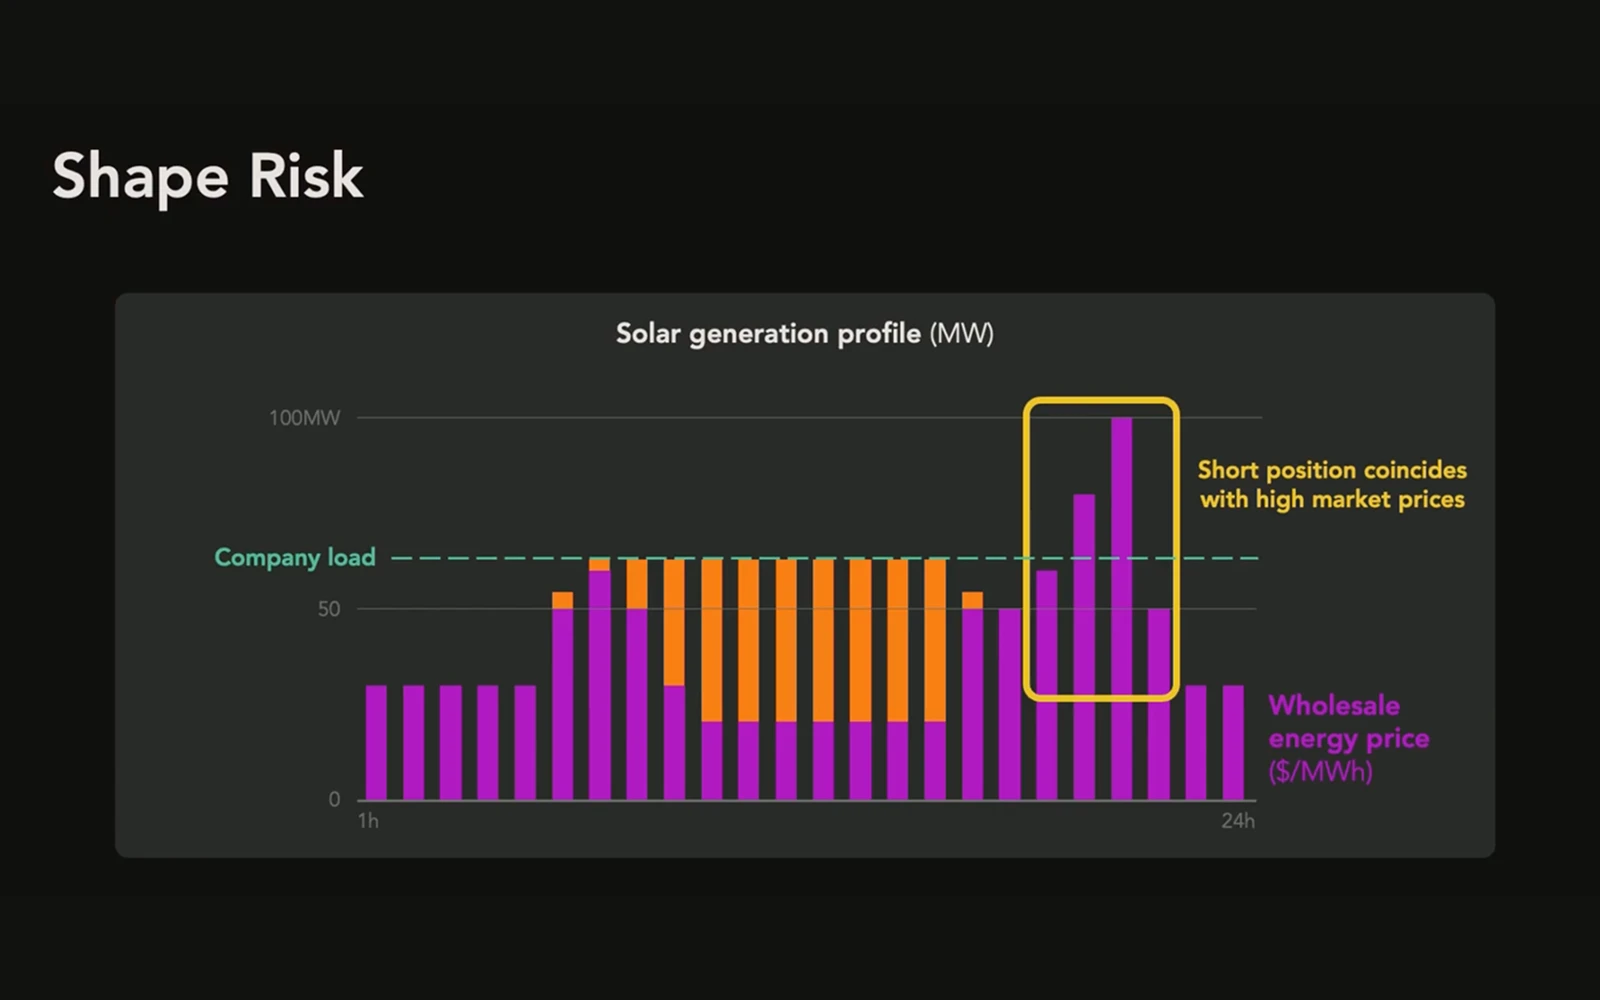
But if Company A wants to assess its overall risk, it also needs to factor in what it expects to spend on its electric load. Load refers to the total amount of electrical power a company consumes at any given moment to operate its facilities, buildings, and equipment. Like a PPA, a company’s forecasted load cost is a probability distribution, not a static number.
Because load costs are often linked to wholesale market prices, it’s important to understand the relationship between the market price Company A pays for its load and the market price associated with its PPA. In an ideal world, the two would track together — so that when Company A pays more for load due to higher market prices, PPA revenue also increases and offsets that higher cost. The more the two price points are uncorrelated, the greater the risk for Company A.
How Energy Risk Management Software Changes the Analysis
When risk is viewed at the portfolio level — which is where energy risk management software adds the most value — the picture changes.. The ERCOT wind PPA has the lowest forecasted mean total cost, but it also carries the widest range of possible outcomes — and therefore the most uncertainty. This is because wholesale market prices in ERCOT can vary significantly from those in MISO, where Company A’s load is located. The MISO solar and wind PPAs, by contrast, settle in the same market as Company A’s load, making their forecasted revenues more closely correlated to load costs. Although they have higher mean costs, their lower standard deviations indicate a narrower range of outcomes — which reduces overall portfolio risk.
As a result, the MISO wind PPA — while the most expensive by forecasted net cost — is also the least risky option at a portfolio level.
Every company will prioritize cost and risk differently. Organizations with a high risk tolerance will focus primarily on minimizing forecasted cost and accept a wider range of outcomes. Risk-averse organizations will pay a premium for greater certainty. Most organizations fall somewhere in the middle.
The key is to conduct a complete analysis of both PPA forecasted net spend and forecasted load spend together — the kind of analysis energy risk management software is built to handle. Without that holistic view, companies are procuring clean power without fully understanding their risk exposure — a gap that energy risk management software is designed to close.
Without power market expertise, historical data, and forward price forecasts — or dedicated energy risk management software — this kind of analysis can be time-consuming and difficult. Verse’s Arya energy risk management software draws on industry-leading expertise, proprietary datasets, and analytical models to run this analysis in minutes — saving your team significant time and money. Contact us to request an energy risk management software demo.